Measure What Matters : Funnel Paths

By using Funnel Paths, you can see exactly how your visitors enter and exit pages on your website.
Part two in a series of four, inspired by the book “Measure What Matters: Online Tools For Understanding Customers, Social Media, Engagement, and Key Relationships,” by Katie Delahaye Paine.
In part one of our series on measurement, we discussed how important it is to set up goals for tracking your web site’s performance. A measurement tool like Google Analytics allows you to measure how effectively your site facilitates these goals, and how users engage with your pages and features.
If users need to navigate through several pages to reach the page you would like them to view, you can set up a URL Destination as a goal for your site. Additionally, you have the option to define a “funnel path” for each goal. A funnel path is a set of pages you expect visitors to view on their way to completing the conversion. For example, a retailer like Best Buy might have a “complete a purchase funnel” made up of the following steps: viewing a product category page, viewing a product page, viewing a shopping cart, and finally, completing an order.
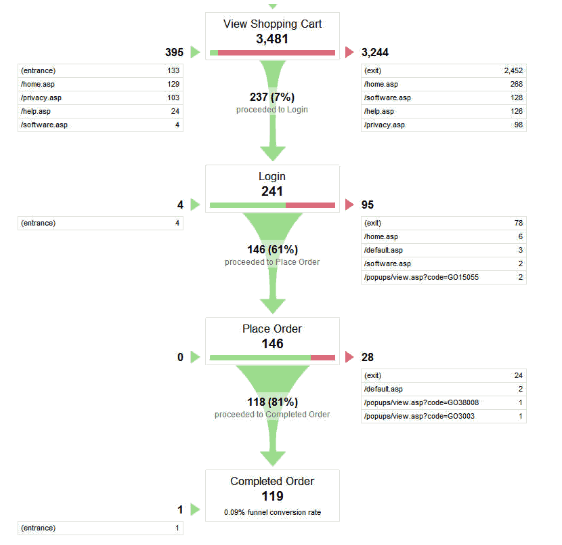
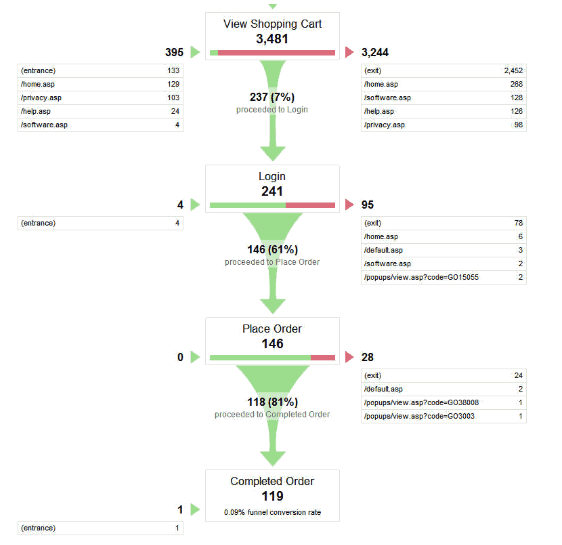
Google Analytics features some powerful visual features that can show you how the funnel path of your site performs. Google Analytics creates a Funnel Visualization report that tells you how many visitors entered and exited each step of the funnel as well as where they came from and where they went.
Here is an example of a “Complete a Purchase” Funnel Visualization Report”

Analyzing the Data
Using the Funnel Visualization Report data above you can clearly see how frequently visitors who begin the conversion process actually complete it. The conversion rates calculated for each stage of the funnel tell you what customers are doing. Now you have to investigate why they are doing it and make changes to the pages that you feel are under-performing.
For example, in the Funnel Report above, we see that 7 percent (237 of 3,481) of visitors who viewed the Shopping Cart page continued to the Login page. Why did the other 3,244 people who viewed the Shopping Cart page exit the funnel path instead of continuing to the login page?
- Did the shopping cart page have too much information?
- Did the page contain a clear call-to-action?
- Did the visitors exit the funnel because they were just not ready to commit to a purchase yet?
It would be hard to answer these questions if you had to analyze the conversion process as a whole entity. The major benefit of creating a funnel path is that it forces you to break down your desired conversion process into smaller more manageable pieces. Knowing where trouble spots are in your desired funnel process takes a lot of guess work out of how to focus your optimization efforts. Improving the conversion rate for a poor performing page might involve changing the marketing content, the look and feel of the design or the call-to-action. Therefore, the funnel report is a perfect set of data to share with your marketing, development, user experience and design teams to help define changes to your web site.
Up to this point we have discussed why your business can benefit from setting goals and creating funnel paths. In Part 3 of this series we will walk through the steps of how to implement goals and funnel paths into your site’s analytics.


